One of the directors wanted an emailer in the customer platform, for customers to use on their own lists, mainly because our main competitor had one. Building it from scratch had always been ruled out on cost, which is why it had never gone anywhere.
I asked the agency who develop the customer platform what was possible. A fully integrated version, the one that would have looked custom built, came back at many thousands more than the business would spend. So rather than report back that it couldn't be done, I looked for a version that could.
In the version I landed on, we hold the account with an established email provider, and each customer gets a login as a user on our account, so they don't need one of their own. They compose their templates there, and when they click the email button in our platform their templates appear and they choose one. Not the fully built-in version the director wanted, but the same service for a fraction of the cost.
It also protected the data. The platform had always been set up so that customers used it by exporting, which meant copies of our database leaving the business. With the emailer in the platform, they had no need to export or pay for an email account of their own.
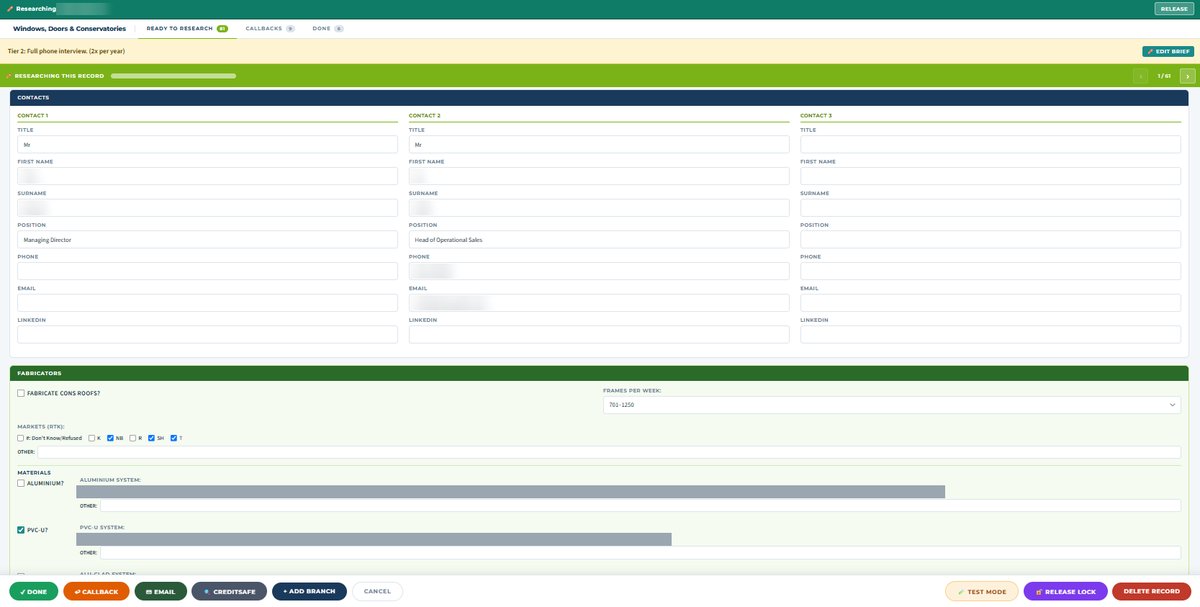
I set out the requirement in writing for the agency, with screenshots showing where the controls should sit: an email-all button, an email-individual button, and which contact an email-all should go to. Then I put the case to the directors, with the agency's quote and mock-ups of how it would look.
One of them pushed back, reasonably, on sending customers to a third-party site to write their emails. My argument was that starting simple would show us whether customers wanted the feature before we spent money on the polished version. That's still the version in use.
Before release I ran it on a test site using our own seed records, so every email came back to us. Two faults turned up that way. Sending to a chosen contact didn't work at first. Worse, where several records shared one generic address, such as branches of a national chain, it sent one email per record, so a chain with 500 branches would have received the same email 500 times. Both were fixed before any customer saw it.
We ran it for three months with one customer at a discounted rate while it was ironed out, and that produced a functional change I hadn't specified: the option to email all the first contacts, or all the second contacts, not everyone on a record. That came from the customer using it.
Five customers have used it since. The six-month minimum term had been there to make sure we were paid properly for data customers could export and keep. Once they could use it without exporting, we could offer much more flexible terms, and four of those five would have ruled us out on cost under the old ones.
The provider's subscription costs around £700 a year and the new business has covered it several times over.